During the 9th Annual Brain Research Through Advancing Innovative Neurotechnologies® (BRAIN) Initiative Meeting, we announced the winners of the fifth Show Us Your BRAINs! Photo and Video Contest. Each year, these videos and images help us visualize how scientists are developing and using the latest technologies to further understand the brain. The winning photos are also featured in the 2024 BRAIN Initiative calendar—order your free copy here while supplies last!
First Place Video Winner: Simian Symphony: Ripple Assemblies During Rest
The first-place winner in the video category. Credit: Kari Hoffman, Saman Abbaspoor, Vanderbilt University; Tyler Sloan, Quorumetrix Studios.
“Simian Symphony: Ripple Assemblies During Rest” is a collaboration between Dr. Kari Hoffman and Saman Abbaspoor at Vanderbilt University, and Dr. Tyler Sloan of Quorumetrix Studios. The video (with audio description) demonstrates a symphony of 256 channels of wireless deep array recordings of the brain, creating a visual and auditory depiction of hippocampal sharp-wave ripples (SWR). These recordings take place in the CA1 layers of the hippocampus, a structure that helps us form durable memories.
The team used a surgically implanted wireless electrode array to record neuronal activity during sleep and break periods during a behavioral task. The CA1 region produced SWRs known to replay sequences of brain activity based on prior experiences. In the video, ripple events are shown by cell location in the CA1 layer. Different functional cell types were selected with respect to physiological and anatomical features (e.g., pyramidal cells, basket cells, and dendritic layer interneurons). The neurons in the video illuminate on and off in blue, cyan, and yellow to display their activity during the highly synchronized SWR events.
In addition to its visual aspects, this video got its name in part because of its auditory elements. After spike sorting neurons into single-unit activity, each unit was assigned a pitch based on depth within the CA1 layer. The deeper the neuron, the lower the pitch, and vice versa. The team mapped the pitches to a C-major scale on a piano. Paired with the visual components, the resulting sound demonstrates the intricate spatiotemporal coordination that marks SWR and indicates their presumptive role in memory making.
Want to learn more about the data used to generate this hippocampal symphony? Check out the Hoffman Lab’s extended video, their recent functional-cell type study in bioRxiv, a highlight in the NIH Director’s Blog, and this paper published in eLife.
Second Place Video Winner: Functional Ultrasound Localization Microscopy
The second-place winner in the video category. Credit: Alexandre Dizeux, Physics for Medicine Paris.
“Functional Ultrasound Localization Microscopy” was made by Dr. Alexandre Dizeux from Physics for Medicine Paris. This video (with audio description) shows what happens to the primary sensory cortex of a rat brain during whisker stimulation. In the video, blood vessels light up blue and orange, turning brighter and more intense as neurons become activated and blood flow changes.
The video was produced using functional ultrasound localization microscopy (fULM), a technique developed by researchers at Physics for Medicine Paris. This technique helps researchers visualize and study brain-wide neurovascular activity. It works by intravenously injecting microbubbles and following them via ultrasound as they circulate throughout the brain’s microvascular system.
Using fULM allowed the lab to image the vasculature deep inside brain tissues, showing vascular changes at the micron scale. This powerful imaging method has a spatial resolution below ten micrometers and a temporal resolution of one second. Researchers used the 3D software platforms Houdini from SideFX to import the resulting data and recreate the neurovascular flows virtually.
One of the goals of our lab is to use this imaging technique to record full vasculature of whole human organs like the heart, brain, or kidney. – Dr. Alexandre Dizeux
Third Place Video Winner: Synaptic Balance
The third-place winner in the video category. Credit: scalable minds.
“Synaptic Balance” was generated by computer and data scientists at scalable minds using a segmented and reconstructed dataset from researchers at the Max Planck Institute (MPI) for Brain Research. The resulting video (with audio description) uses Blender’s animation software and WEBKNOSSOS, a 3D imaging platform, to take the viewer on a flight inside of a cluster of inhibitory and excitatory neurons in the human cortex. About halfway through, the video zooms in to visualize neural activity and the relationships between neurons through their cell bodies, dendrites, and tiny microstructures.
The video was made possible thanks to artificial intelligence models and high-performance computing environments. The team at MPI used serial block-face electron microscopy (SBEM) to capture a series of images from a tissue sample of the human cortex, then scalable minds digitally reconstructed that sample using their Voxelytics machine learning toolkit. The team carefully segmented the data to reduce errors and identify every detail down to spine heads and nearly a million synapses. The full dataset was published online in WEBKNOSSOS and is openly available to explore.
When creating “Synaptic Balance”, the team discovered that synaptic connectivity in the human cortex may be sparser compared to other species. They also learned that the human cortex has about three times more interneurons than the mouse cortex, which may indicate greater interneuron connectivity.
The video represents a great achievement for our team to routinely produce connectomics reconstructions for comparative studies. We have effectively showcased the capabilities of Voxelytics to rapidly and fully automatically generate connectomes for a significant number of SBEM datasets. Our technology has significantly reduced the time and human effort previously required for such reconstructions, which used to take months to complete. – scalable minds
First Place Photo Winner: Dark Commute at 4am
The first-place winner in the photo category. Credit: Silas Busch, University of Chicago.
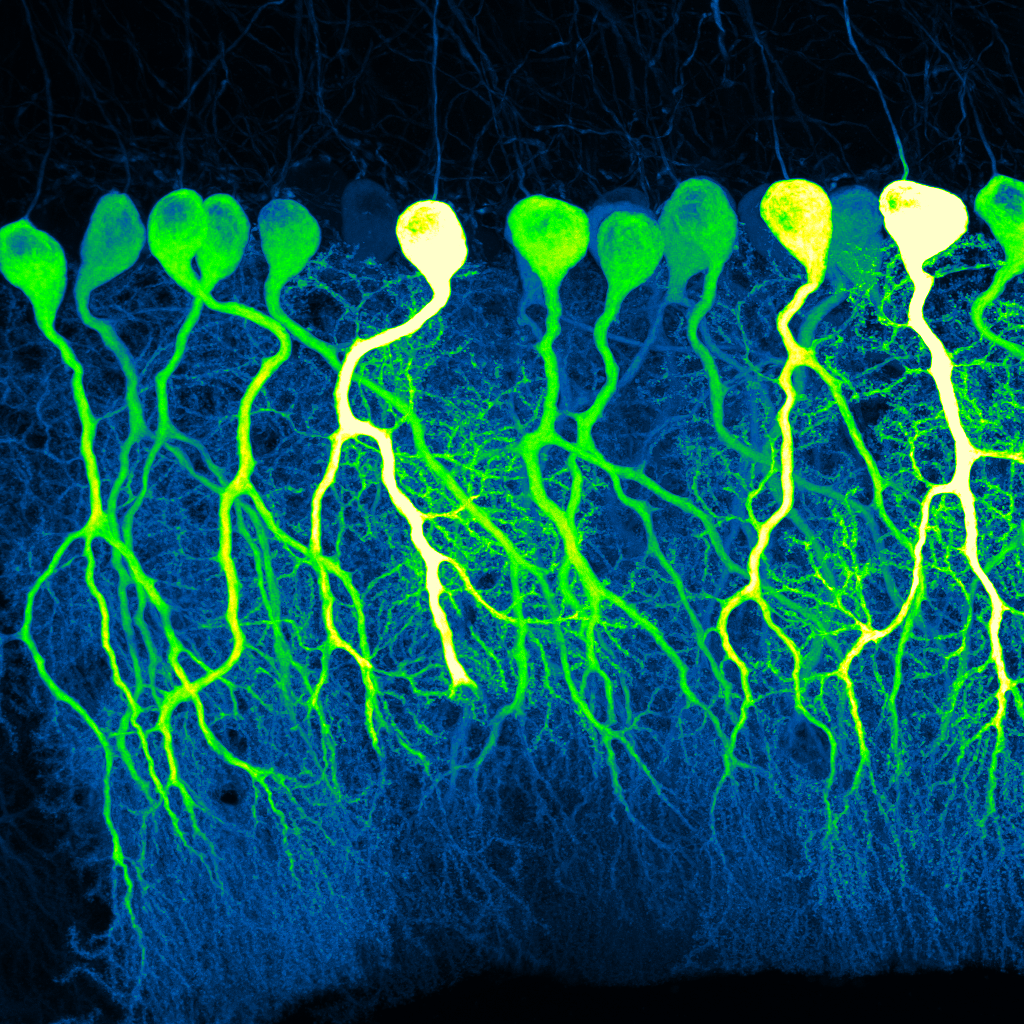
“Dark Commute at 4am” was created by Silas Busch at University of Chicago’s Hansel Lab. This image was produced with confocal microscopy, which uses a laser to illuminate and zoom in on fluorescently labeled cells in thin slices of brain tissue. Shown here are delicate Purkinje cells in the mouse cerebellum. The photo exemplifies the complexity of these cells and their dendritic spines. The GCaMP6f-expressing cells are illuminated in green. Busch named the photo “Dark Commute at 4am” because of the cells’ semblance to human commuters traveling to work before dawn.
The Hansel Lab studies cerebellar Purkinje cells in mice to better understand their complexity and role in learning, memory, and movement control. According to Busch, the contours in the photo appear human-like, with literal and metaphorical signs pointing to new research that is comparing Purkinje cells in humans and mice. This first-place photo winner was also featured in the NIH Director’s Blog.
We are uncovering the importance of branching patterns in critical functions of this cell and unveiling the similarities—and differences—of Purkinje cells in mice and humans. – Silas Busch
Second Place Photo Winner: Premotor Neurons Controlling the Fruit Fly Leg
The second-place winner in the photo category. Credit: Andrew Cook, Anthony Azevedo, Ellen Lesser, Leila Elabbady, Brandon Pratt, and John Tuthill, University of Washington; and Jasper Phelps and Wei-Chung Allen Lee, Harvard Medical School.
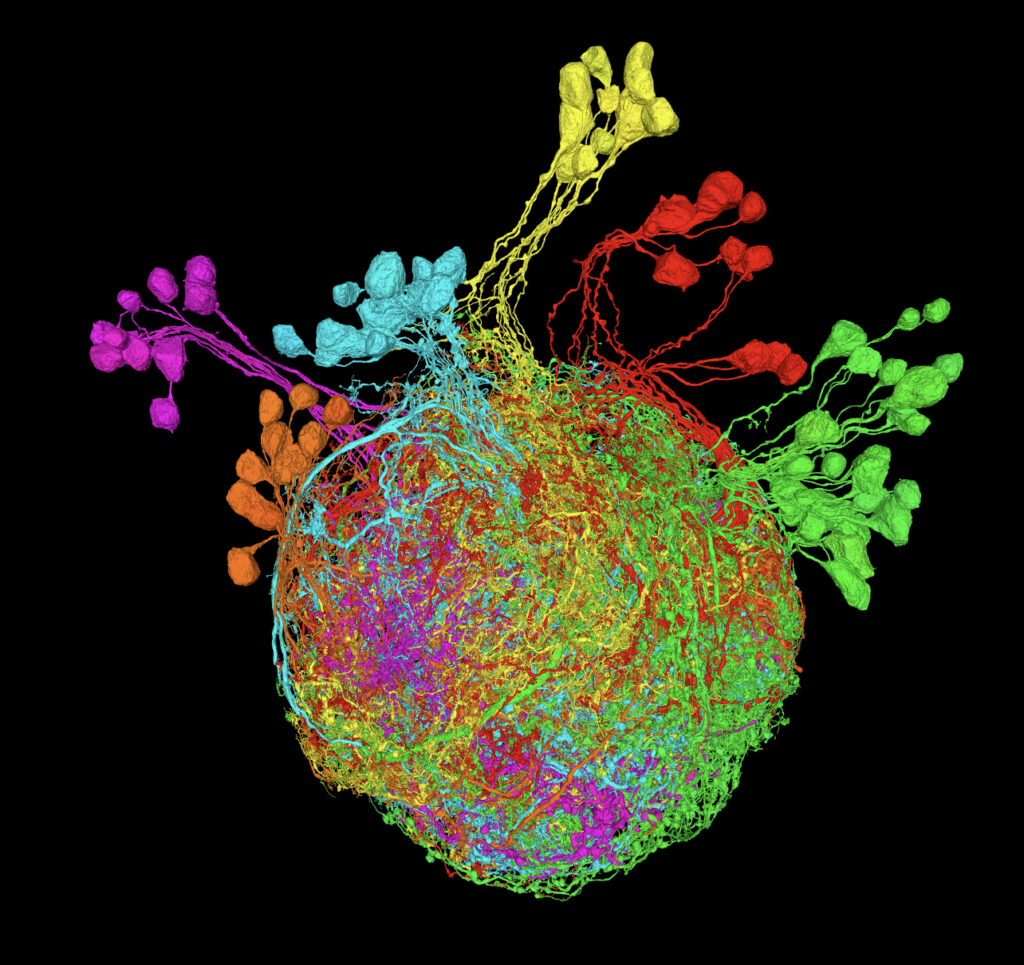
“Premotor Neurons Controlling the Fruit Fly Leg” was produced by Andrew Cook, Dr. Anthony Azevedo, Ellen Lesser, Leila Elabbady, Brandon Pratt, and Dr. John Tuthill from the Tuthill Lab at the University of Washington, and Drs. Jasper Phelps and Wei-Chung Allen Lee of the Lee Lab at Harvard Medical School. The team reconstructed an automated serial section electron microscopy (ssEM) dataset to digitally generate a colorful image of premotor neurons in the leg of an adult female Drosophila, also known as a fruit fly. The various colors show different lineages or origins of premotor neurons within the nerve cord.
To create the image, the team used machine learning algorithms to automate neural structure segmentation, then merged and cut those segments to ensure there were no errors. From there, the team determined the developmental lineages of each premotor neuron based on its structure.
The Tuthill Lab uses this approach to better understand how motor neurons work, what their circuit properties are, and to identify neural differences in the legs and wings. “Premotor Neurons Controlling the Fruit Fly Leg” is part of an effort to establish, analyze, and disseminate a leg and wing premotor connectome to map neural connections in the fruit fly, which will build the foundation for future connectome research in flies and other limbed animals.
This photo represents an amazing collaborative effort from many folks interested in understanding motor control in animals. This has been a true team effort in the way folks have been willing to share information and help with reconstruction to achieve the goal of understanding what drives these motor neurons. It’s been awesome to see how this project has progressed in terms of the improvement of reconstruction tools and the development of an information database. – Andrew Cook
Third Place Photo Winner: Memory Lanes
The third-place winner in the photo category. Credit: Dr. Tyler Ard, University of Southern California.
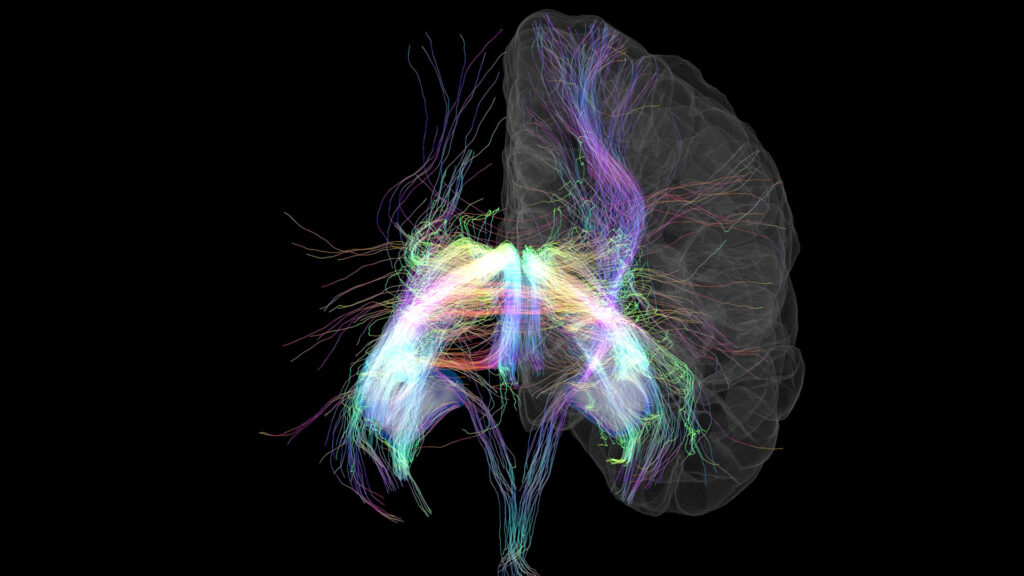
“Memory Lanes,” by Dr. Tyler Ard at the University of Southern California, depicts two combined MRI brain scans (cortical surface and hippocampal segmentations) of the same human subject. The first scan is a T1-weighted scan that shows the surface of the brain to illustrate the location of the hippocampus, shown in blue. The second scan uses diffusion tractography to map out the axon bundles, or nerves, that connect brain regions. Together, the scans display where cranial nerves connect to the hippocampus, using different colors to show the relative direction of each nerve.
The data in this image is critical for human brain connectomics research and helps investigators learn about consciousness, cognitive abilities, and may lead to better diagnoses for neurological diseases.
Dr. Ard and his team combine large datasets from around the world to study the structure and physical connections in the brain—and “Memory Lanes” is just the beginning. This image shows only less than one percent of the data that the team collected from the two MRI scans.
This photo represents progress. By building on scientific ideals over centuries, we are now to a point where we can see truly fine brain structures and details of living people, from only a few minutes in an MRI scanner. This figure simply portrays ‘what’ we can see with the wonders of modern science. – Dr. Tyler Ard
Congratulations to all the 2023 winners! If you’re interested in submitting an image or video in the next Show Us Your BRAINs! Photo and Video Contest, you can participate in Spring 2024. Visit the contest page and subscribe to the BRAIN blog for updates.
Love what you see? Check out more stunning imagery of the brain in previous ‘Art of the BRAIN’ series below: