This year’s Show Us Your BRAINs! Photo and Video Contest delivered some fascinating depictions of the brain. Check out the winners and read about the tools and techniques used to capture their images.
As part of the virtual 8th Annual Brain Research Through Advancing Innovative Neurotechnologies® (BRAIN) Initiative Meeting, we hosted the fourth Show Us Your BRAINs! Photo and Video Contest. Here we feature the winning entries and recognize the researchers who created them. These imaging capabilities serve as a prime example of how The BRAIN Initiative® is advancing neurotechnologies to enhance our understanding of the brain. This year’s photos are also part of our BRAIN Initiative Calendar (don’t miss out and order a free copy here while supplies last!).
First Place Video Winner: Neurons in Action
The first-place winner in the video category. Credit: Andreas Tolias, Jacob Reimer, and Xaq Pitkow, Baylor College of Medicine; R.J. Cotton, Northwestern University/Shirley Ryan AbilityLab; Nuno da Costa, Forrest Collman, and Clay Reid, Allen Institute; and Sebastian Seung, Princeton University.
“Neurons in Action” represents a dataset collected by multiple labs as part of the Intelligence Advanced Research Projects Activity (IARPA)’s Machine Intelligence from Cortical Networks (MICrONS) project. This video (for video with audio description, click here) demonstrates functional activity of neurons in mice measured in vivo with two-photon imaging and electron microscopy.
The video was a collaborative effort between Drs. Andreas Tolias, Jacob Reimer, and Xaq Pitkow from the Baylor College of Medicine; R.J. Cotton, from Northwestern University/the Shirley Ryan AbilityLab; Nuno da Costa, Forrest Collman, and Clay Reid from the Allen Institute; and Sebastian Seung from Princeton University.
Work for the video first began at the Center for Neuroscience and Artificial Intelligence at Baylor College of Medicine, where the Baylor team recorded neuronal activity from the visual cortex of awake mice while the mice viewed movies. Next, the team captured super-resolution images of the neurons at the Allen Institute, detailing their anatomical structure at nanoscale resolution.
The team then took the data collected at the Allen Institute to Princeton University, where researchers used powerful machine learning algorithms trace the detailed morphology of each individual neuron and the connections between them. They aligned the functional and anatomical data together to yield a massive connectomic dataset with both the function and structure of each neuron. These multimodal data were imported in Blender, an open-source 3D computer graphics software tool. Finally, collaborators at the Center for Bionic Medicine at the Shirley Ryan AbilityLab produced the video.
In the video, the cells move from their true anatomical locations into a circle based on their functional properties. The cells are grouped by orientation tuning, a canonical functional property of neurons in the visual cortex.
According to Dr. Tolias, integrating neural form, connectivity, molecular information, and function in the same neurons will lead to large breakthroughs in our understanding the mammalian brain, and eventually revolutionize how we diagnose and treat neuropsychiatric disorders. Additionally, projects like this will accelerate the development of artificial intelligence technologies that are better and more energy efficient.
The movie is unique since it shows for the first time both the structure and activity of the same neurons in the cerebral cortex. These types of combined functional and structural data hold the key to deciphering the neuronal mechanisms of cognition, perception, and motor control. – Andreas Tolias
Second Place Video Winner: Ictal Cinema
The second-place winner of the video category. Credit: Jon Kleen, University of California San Francisco.
“Ictal Cinema” (for video with audio description, click here) demonstrates the transforming intracranial recordings of a patient’s ongoing seizure into a heatmap (line length transform) using a 3D reconstruction of the patient’s brain. The fusion of intracranial electroencephalogram (iEEG) and biomedical imaging reveals how fascinating and versatile seizure activity is—in this example, the activity smolders in a single focal area, but also moves and sends massive bursts of activity that travel across multiple lobes of the brain.
The video was created by Dr. Jon Kleen of the University of California San Francisco to showcase the Omni-planar and Surface Casting of Epileptiform Activity (OSPCEA) approach, a novel visualization method that converts complex recordings (black traces on the right) into an intuitive “heatmap”, which can be projected onto a 3D reconstruction of the patient’s brain (hemisphere of a patient’s brain shown on the left).
The black dots on the brain render (left) are individual electrode placements, and the black lines (right) are individual traces of continuous neural activity from each electrode. Seizure intensity is calculated automatically from the data in the thin grey window (arrow) and converted into color intensity using a normalized “line length” algorithm.
This stunning visualization helps us understand how real seizure activity moves in space and time. The technology also uses “slice views” (example shown halfway through the video) to examine activity from neurons deep in the brain.
When someone’s seizures are resistant to medicines, one treatment option—though risky—is open brain surgery. Neurosurgical implantation of electrodes can be used to locate brain tissue deemed the source of seizures, and the brain tissue is then removed (resected). This treatment is usually effective; however, seizure localization is tedious, and the intracranial recordings are difficult to interpret, with hundreds of electrodes in different places for each patient. In the case of the patient in “Ictal Cinema,” the seizure heatmap revealed that the widespread activity all originated from a single seizure source (“hotspot”) in the medial temporal lobe, which sent off bursts that rapidly propagated to the front and top of the brain (frontal lobe) and then quickly moved toward the back of the brain (parietal lobe). Thanks to this innovative approach, the patient had the hotspot removed and has been seizure free since then.
In addition to applying this technology clinically, Dr. Kleen and his team have created a library of seizure videos like this one, from over 130 patients and are using this technology to tackle new areas of neuroscience and epilepsy research. This includes characterizing and understanding different types of seizure spread patterns by watching how they behave across the brain, similar to understanding how types of wildfires spread. They are also working to understand which brain regions are involved in the behavioral symptoms of seizures, such as a strong head turn or arm extension.
This video means a lot to myself and to my colleagues who helped take care of this patient, because before their recording we thought she had multiple sources of seizures – this often precludes a resection surgery. – John Kleen
Third Place Video Winner: A Pyramidal Christmas Tree
The third-place winner in the video category. Credit: Forrest Collman, Allen Institute.
This video (for video with audio description, click here) shows a digital rendering of a thick tufted pyramidal neuron in layer five of the mouse cortex. One of the largest neurons in the cortex, this neuron has over 14,000 synaptic connections. The video used data from IARPA’s Machine Intelligence from Cortical Networks (MICrONs) dataset, a large-scale electron microscopy project.*
“A Pyramidal Christmas Tree” was submitted by Dr. Forrest Collman of the Allen Institute, who imported it into Blender, an open-source rendering software, along with a dataset with synapse locations. In the video, each synapse twinkles randomly over time to approximate the activity of thousands of synaptic inputs coming into this cell.
To create the video, a portion of the brain was cut into thousands of nanometer-thin sections and millions of high-resolution images were taken of those sections. All of the images were stitched together into a 3D volume where neurons were traced. Machine learning algorithms were trained to trace out the structures and detect the locations of synapses on all the neurons inside this volume—data that is available at MICrONs-explorer.org.
When embarking on this project, Dr. Collman wanted to convey the level of complexity and richness that exists within this data and in the brain. The project highlighted the difficulty in unravelling the mechanisms behind how neurons work within the intricate networks of the cortex. Dr. Collman’s favorite thing about this project is the ability to have data like this at all—any viewer can see actual neurons and their precise shapes and how they connect to one another without having to go into a lab or look through a microscope.
*Both the first place and third place video contest winners used data that came from IARPA’s MICrONs project, through different datasets within that project.
For me, the video highlights the similarity in the structure of neurons and trees and reminds me of the childlike awe that the holidays evoke in us and that I feel sometimes looking through this data. – Forrest Collman
First Place Photo Winner: The Intersection of Memory and Memory
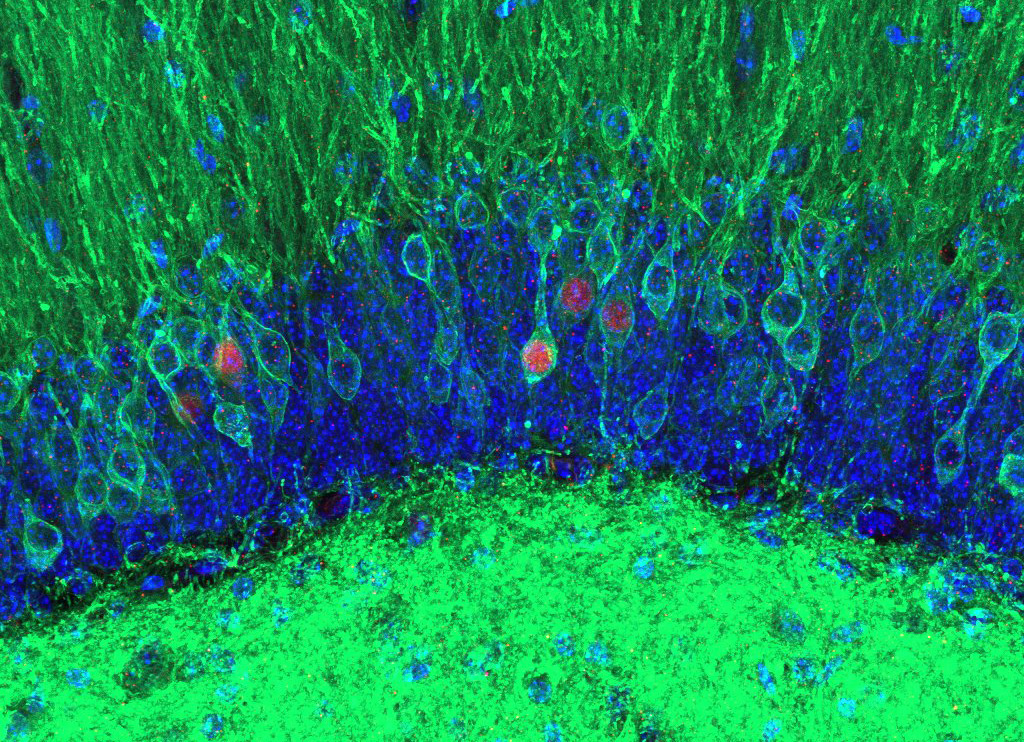
The first place winner of the photo category. Credit: Stephanie Grella, Boston University.
Pictured above are two memories in physical form, called engrams, captured under a confocal microscope following immunohistochemical staining. The image, created by Dr. Stephanie Grella, Assistant Professor at Loyola University Chicago, looks into the hippocampus of a mouse using viral technology and optogenetics during her postdoctoral fellowship at Boston University.
To create the image, Dr. Grella and her team injected mice with a virus to genetically label cells in the hippocampus with a light-sensitive opsin (ChR2) and a fluorescent green reporter (eYFP; with cell nuclei stained blue). The mice were then exposed to a negative stimulus (fear-conditioning) and given a fear memory recall test the next day. During the memory recall test, the team artificially reactivated the tagged cells using blue light to try to disrupt the negative fear memory. This was done via reactivation of a competing set of cells during fear memory reconsolidation.
After the recall test, the mice were re-exposed to the conditioning chamber to assess whether this approach reduced conditioned fear and/or altered the fear engram (engram cells in pink, cFos-RFP). The experiment successfully modulated both the conditioned fear response and engram.
To Dr. Grella, “The Intersection of Memory and Memory” shows how malleable our memories really are—they are not fixed snapshots of the past—they are always changing. This snapshot is connected to a larger set of experiments investigating novel and innovative ways to modulate memories such as the negative, unwanted memories that characterize post-traumatic stress disorder.
This image signifies the palpability of learning, and how incredible it is to be able to see a memory under the microscope. – Stephanie Grella
Second Place Photo Winner: Mind Map
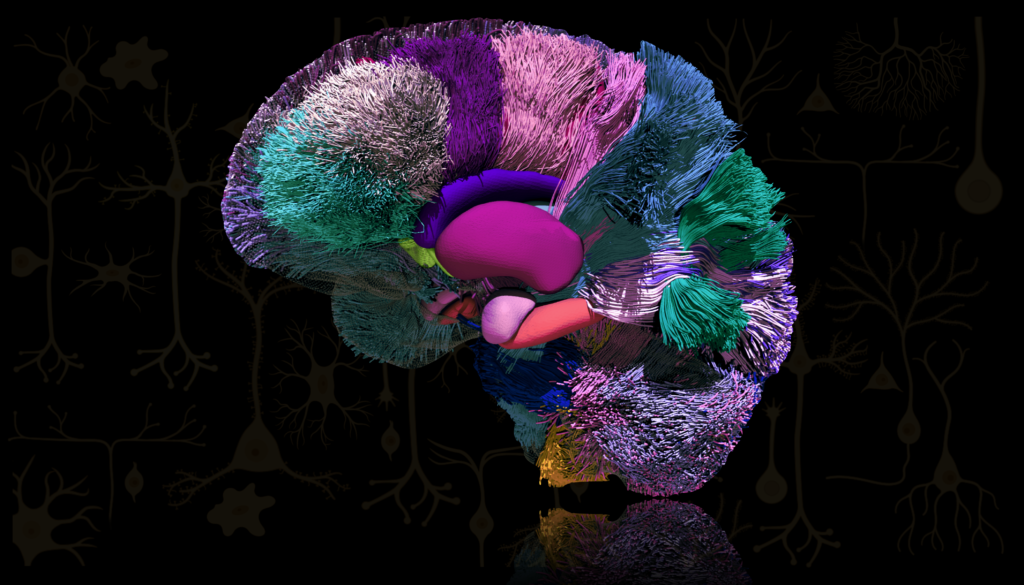
The second-place winner of the photo category. Credit: Sahar Ahmad, Ye Wu, and Pew-Thian Yap, University of North Carolina at Chapel Hill.
“Mind Map” demonstrates how brain activity is orchestrated by propagating information between brain regions through white matter fiber tracts, visualized through data collected via diffusion MRI (dMRI) tractography. Each color highlights a different brain area and associated fibers: amygdala (pink), putamen (magenta), caudate nucleus (purple), hippocampus (orange), and nucleus accumbens (green).
The photo was created by Drs. Sahar Ahmad, Ye Wu, and Pew-Thian Yap of the University of North Carolina at Chapel Hill, whose research is supported by the BRAIN Initiative. The team uses comprehensive maps of neural connections to study how different brain regions are interconnected and how these brain regions communicate with each other, allowing us to investigate the dynamics of brain development and maturation.
Because the human brain is an enormously complex network of interconnected neurons, precise cellular mapping of neural interconnections provides fascinating insights into brain organization, functional dynamics, and communication architecture.
This artwork illustrates the marvel of the intricate wiring patterns of the human brain. – Sahar Ahmad
Third Place Photo Winner: Thinking Lincoln
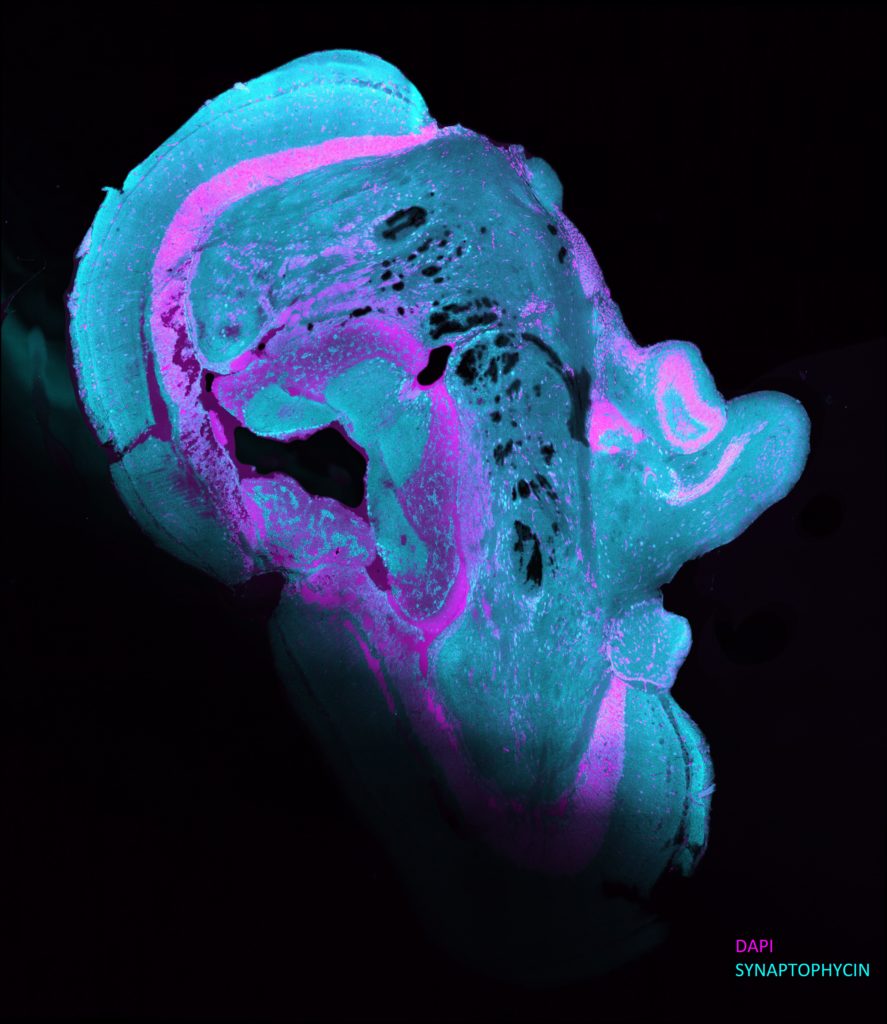
The third-place award winner in the photo category. Credit: Esengül Öztürk, Çanakkale Onsekiz Mart University.
This image depicts a zebrafish brain tissue section labeled with fluorescence stain. “Thinking Lincoln” was given its name due to its uncanny resemblance to President Abraham Lincoln’s side profile. The photo was created by Esengül Öztürk, an undergraduate student and member of the Arslan-Ergul lab in the Department of Molecular Biology and Genetics at Çanakkale Onsekiz Mart University in Turkey.
To create this image, Öztürk and her team optimized a new staining protocol for synaptophysin (cyan), a marker protein associated with aging and neuron loss. Neurons in the zebrafish have the unique ability to regenerate, making them an optimal animal model to investigate genes involved in age-related neurodegeneration. The lab uses cutting-edge microscopy techniques to examine old and new neurons at the molecular and genetic level. They are now collaborating with international researchers to develop new methods to aid in diagnosing various brain diseases in humans, bringing findings in the zebrafish to clinical studies.
These results are exciting because they may one day inform the diagnosis of several neurodegenerative diseases, such as Alzheimer’s disease, Parkinson’s disease, and dementia. – Esengül Öztürk
Congratulations to all of the 2022 winners! If you’d like to take part in the next Show Us Your BRAINs! Photo and Video Contest, you can submit your best image or video in Spring 2023! Visit the contest page for updates.
Love what you see? Check out more stunning imagery of the brain in the 2021 ‘Art of the BRAIN’ series below: