As part of the virtual 7th Annual Brain Research Through Advancing Innovative Neurotechnologies® (BRAIN) Initiative Investigators Meeting, we hosted the third Show Us Your BRAINs! Photo and Video Contest. In this article, we feature the winning entries and recognize the researchers who created them. Made possible by innovative technologies, these images are a prime example of how The BRAIN Initiative® is accelerating our understanding of the brain. This year’s photos are part of our BRAIN Initiative Calendar (order a free copy here while supplies last!).
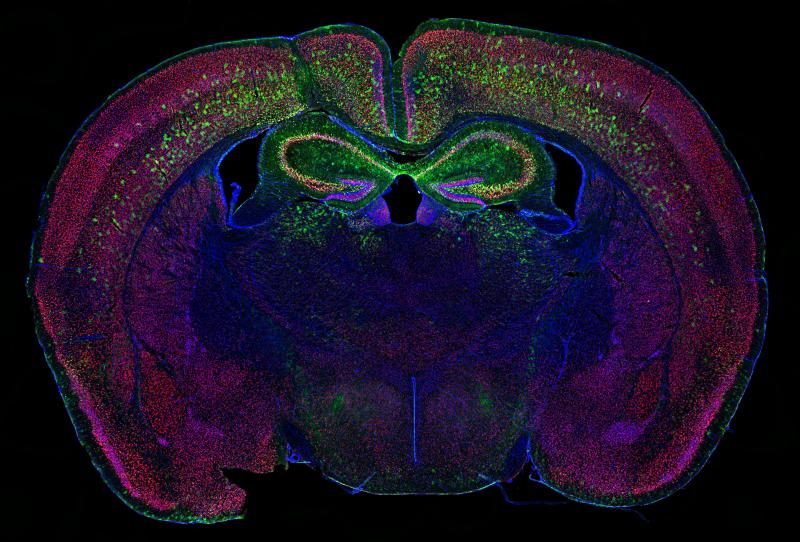
“Thinking About A Greener Future” won first place in the photo category. Credit: Allen Yen, Ph.D. Candidate, Washington University School of Medicine, St. Louis, MO.
Pictured above is a slice of mouse brain tissue displaying neurons (red) and cell nuclei (blue). It was submitted by Allen Yen, a Ph.D. Candidate in Dr. Joseph Dougherty’s lab at Washington University School of Medicine, St. Louis.
In collaboration with the lab of Dr. Rob Mitra, Yen and his team used a powerful microscope to capture dozens of small, detailed pictures that they stitched together to create this stunning high-resolution image. Green neurons in the cortex (top) and hippocampus (two lobes in the center) were labeled with a cutting-edge genetic technology known as “calling cards.” Calling cards are used to track important molecular events in a cell’s genetic makeup by marking locations in the genome where transcription factors have visited. Transcription factors are molecules that turn on and off specific genes to determine cell fate. By tracking their activity, scientists can create a historical record of how different brain cells develop.
Calling cards also encode a bright fluorescent marker (called green fluorescent protein) to reveal where they are in the brain. Yen is now applying this innovative tool to study how brain development is altered in mouse models of neuropsychiatric disorders, such as autism spectrum disorder. This photo was the first of many from the contest featured in the NIH Director’s blog. Check it out here.
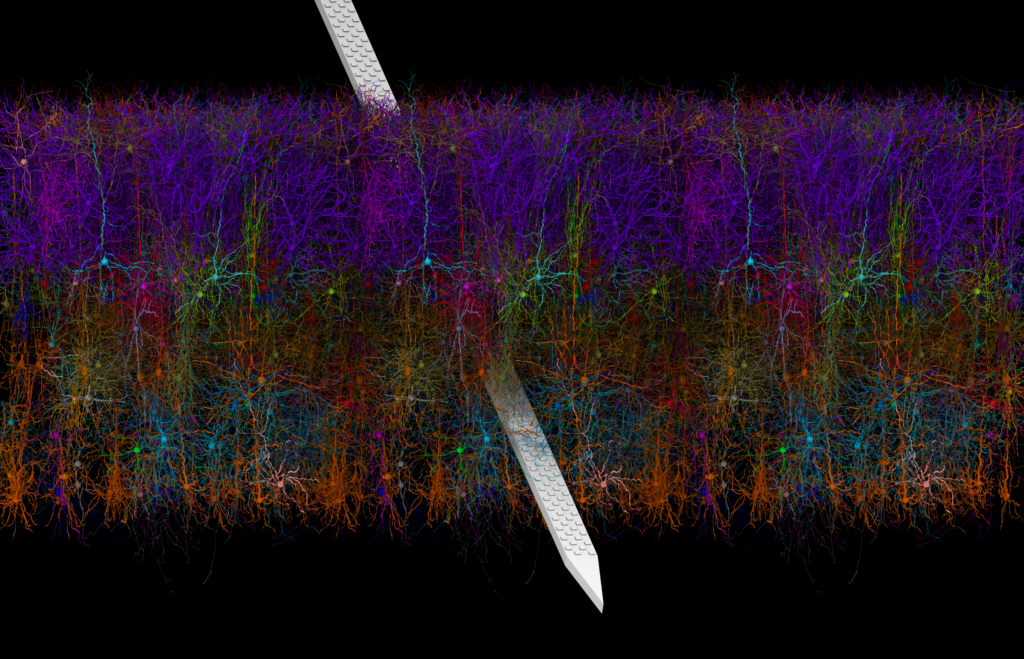
“Model of Mouse V1 With A Neuropixels Probe” won second place in the photo category. Credit: Barry Isralewitz, John Stone, Mariano Spivak, Kael Dai, and Emad Tajkhorshid, University of Illinois, Urbana-Champaign, Urbana, IL; Josh Siegle and Anton Arkhipov, the Allen Institute for Brain Science, Seattle, WA.
Shown here are colorful layers of neurons in the mouse primary visual cortex (known as V1), a brain area that receives and processes visual information. The image was submitted by Barry Isralewitz, Ph.D., a Research Programmer at the University of Illinois, Urbana-Champaign.
To create this image, Dr. Isralewitz worked with a team of neuroscientists and software engineers from the University of Illinois and the Allen Institute. They used a new open-source software tool called Visual Neuronal Dynamics (VND), which can display an enormous number of cells and analyze their connections using powerful 3D graphics and data processing pipelines. Each color corresponds to a different cell type. Excitatory neurons (purple, cyan, red, orange) weave their projections through inhibitory neurons (green, blue, magenta). Piercing the colorful neuronal web is a Neuropixels probe (silver), a tiny, but powerful, silicon device used to record the activity of hundreds of neurons at once.
The model used to create this image is just amazing; it contains 230,000 neurons of 17 different cell types. – Barry Isralewitz
VND and other data visualization tools help neuroscientists and scientists from other disciplines study how specific cell types interact and how complicated brain networks (like this one) process information. Eventually, such computational approaches will advance our understanding of the structure and function of complex networks in the healthy and diseased brain.
This technology is just a small part of the BRAIN Initiative’s ongoing effort to build a whole-brain atlas of cell types across species, from mice to humans. To learn more about this incredible software, read the NIH Director’s blog post and the University of Illinois news release.
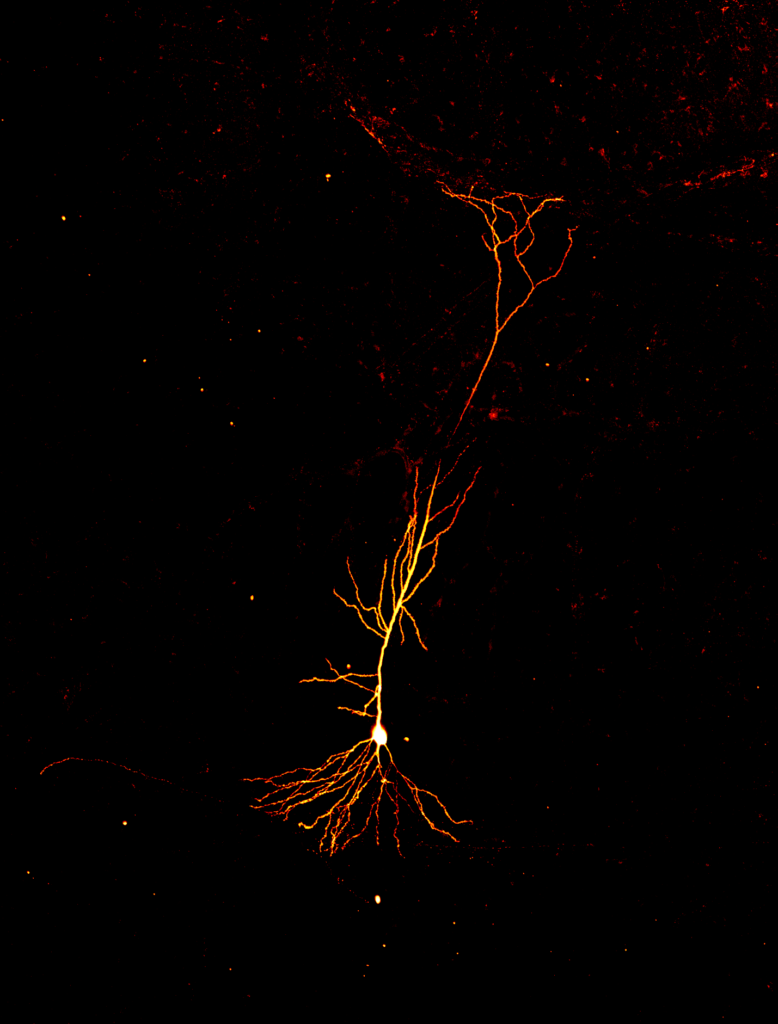
“Neuron on Fire” was awarded third place in the photo category. Credit: Olesia Bilash, New York University.
The image above is a pyramidal neuron in the mouse hippocampus, the learning and memory center of the brain. This image nicely depicts two compartments of the neuron: the cell body (white oval) and dendrites (orange branches). The photo was created by Olesia Bilash, a Ph.D. Candidate in Dr. Jayeeta Basu’s lab at the New York University School of Medicine.
In the lab, Bilash took a brain slice, placed it in a petri dish, and zoomed in on neurons with a microscope. Then she used a thin, fragile electrode threaded through a pipette to record electrical signals from a dendrite, a structure that receives signals from nearby neurons. The gap in the middle of the orange dendritic tree marks the spot where the tip of the pipette punctured the cell. Moments before taking this snapshot, she filled the neuron with a fluorescent dye to illuminate its fiery branches. Mouse dendrites are over 50 times thinner than a human hair, making them very challenging to record from—even for a highly skilled slice electrophysiologist.
Despite its difficulty, neuroscientists use this age-old technique to study neural signals unique to dendrites, allowing them to uncover exciting new information about the brain’s memory circuits.
“DBS Lead Placement For OCD” won first place in the video category. Credit: Nicole Provenza, Raissa Mathura, Noam Peled, Evan Dastin-van Rijn, Kelly Bijanki, Sameer Sheth, David Borton, and Wayne Goodman, Brown University, Providence, RI, Baylor College of Medicine, Houston, TX, MGH/HST Martinos Center for Biomedical Imaging, Charlestown, MA.
This video shows a 360-degree view of the brain of a person with obsessive compulsive disorder (OCD), a neuropsychiatric disorder characterized by uncontrollable, recurring thoughts and repetitive behaviors. The video was a true collaborative effort. Dr. Nicole Provenza, a recent graduate in the lab of Dr. David Borton at Brown University, produced it with the project’s lead investigator Dr. Wayne Goodman, lead neurosurgeon Dr. Sameer Sheth, and research assistant Raissa Mathura, all at Baylor College of Medicine, along with Dr. Noam Peled at the MGH/HST Martinos Center for Biomedical Imaging.
The individual was a participant in a clinical trial aimed to treat severe OCD using deep brain stimulation (DBS). DBS involves surgically implanting thin wires called electrodes deep into the brain. The device sends electrical impulses or signals that modulate abnormal brain activity, which helps alleviate OCD symptoms. Stimulation levels are controlled by a medical device similar to a pacemaker that is placed under the skin in the chest. Here, the DBS leads were placed into the ventral striatum (yellow) or the bed nucleus of the stria terminalis (not shown), two key OCD-related regions.
At about halfway through, the video zooms in on a cluster of brain regions used to target DBS placement during surgery. These include the anterior commissure (orange), which transfers information between the brain’s hemispheres; caudate nucleus (dark blue), a structure important for motor control, learning, and memory; putamen (light blue), involved in fine tuning motor functions and learning; and ventral striatum (yellow), which plays a role in decision-making and reward-related behavior.
To make the video, after DBS surgery, Provenza, Mathura, Peled and their colleagues carefully aligned magnetic resonance imaging (MRI) and CT scans of the brain. Then they used specialized software called the Multi-Modal Visualization Tool (MMVT), developed by Peled, to reconstruct the brain’s surface, deep structures, and lead placement. The images produced by MMVT were stitched together to create this incredible 3D visualization.
With tools like MMVT in hand, the research team recently developed a new DBS system capable of fine-tuning stimulation levels in response to brain activity and OCD symptom intensity. This winning video was recently featured in the NIH Director’s blog.
“Pyramidal Tract Reconstruction In Vivo” tied for second place in the video category. Credit: Patryk Filipiak, Timothy Shepherd, Ying-Chia Lin, Dimitris G. Placantonakis, Fernando E. Boada, and Steven H. Baete, New York University School of Medicine, New York, NY.
Pyramidal tracts (left and right) are neural connections that link the motor area of the brain with the spinal cord. Through these thick bundles of nerves, the brain sends electrical signals to the body. These signals control a range of important movements—from voluntary movements of hands and legs, to facial expressions and swallowing. The amazing video was produced by Patryk Filipiak, Ph.D., Postdoctoral Fellow, and his colleagues at the NIH-funded Center for Advanced Imaging Innovation and Research (CAI2R) at New York University Grossman School of Medicine.
To create 3D reconstructions of the brain, neuroscientists combine specialized MRI with computer modeling tools, known as diffusion MRI tractography. This method can produce decent renderings. But the resolution can be poor in parts of the brain where fibers cross at angles less than 40 degrees. At about three seconds into the video, the branching fibers at the top are clear, but the bottom part of the image looks fuzzy and distorted—precisely where fibers cross at narrow angles.
To fix this, Dr. Filipiak and his colleagues applied a powerful computational method originally developed by Drs. Steven H. Baete and Fernando E. Boada called orientation distribution functions (ODF)-Fingerprinting. The method uses sophisticated statistics to identify fiber directions at narrow angles. These direction data are then applied to MRI images, resulting in a clearer, less-distorted final image. Starting at 10 seconds into the video, you can see the colorful fibers of the pyramidal tract emerge. Each color represents the primary direction orientation of nerve fibers: left to right (red), top to bottom (blue), and back to front (green). Orange, magenta, and yellow represent combinations of these orientations.
The stakes are very high because the accuracy of fiber reconstruction not only impacts scientific modelling of the human brain, but also plays a role in neurosurgical planning. We believe that ODF-Fingerprinting has a huge potential in both fields. – Patryk Filipiak
By refining ODF-Fingerprinting, Dr. Filipiak and his team hope to model the pyramidal tract at even higher resolutions. Learn more about his quest to capture a sharper image of the pyramidal tract by viewing the NIH Director’s blog post featuring this award-winning video.
“Non-invasive In Vivo Mapping Of The Human Amygdala Circuit” tied for second place in the video category. Credit: Josue Avecillas-Chasin, Ausaf Bari, and Jean-Philippe Langevin, University of California, Los Angeles, Los Angeles, CA.
This video shows a wiring diagram of the amygdala, a region known for processing fear, emotion, and memory. It was created by Josue Avecillas-Chasin, M.D., Ph.D., a neurosurgeon and Postdoctoral Fellow in Dr. Jean-Philippe Langevin’s lab at the University of California, Los Angeles. The amygdala is a small structure located deep in the brain and its circuit is complex, making this video quite an achievement for Dr. Avecillas-Chasin and his colleagues.
To create the video, researchers combined three methods. First, they used a non-invasive, high-powered MRI machine to visualize the structure of the brain’s cortex or outer layer (grey). Next they used diffusion MRI to construct a 3D diagram of nerve fibers across the whole brain. At about eight seconds into the video, you can see a rainbow of connections emerge. This stunning diagram is composed of 30 million fibers and represents data collected from 71 healthy research participants.
Lastly, researchers used specialized computational methods to map the amygdala circuit, which appears at about 12 seconds into the video. Similar to the pyramidal tract animation above, each color represents the directional orientation of the fibers.
This animation is not simply a work of art for us to admire; it’s a useful reference atlas of the human amygdala circuit. Researchers will use this map to develop new, more precise treatments for psychiatric disorders, including post-traumatic stress disorder (PTSD), addiction, and depression. With funding from the BRAIN Initiative, Dr. Langevin’s research team is now using this map to inform clinical studies aimed to improve neurostimulation therapies for veterans with PTSD.
“Reconstructed Mouse Cervical Spinal Cord” won third place in the video category. Credit: Jamie Anne Mortel, Salk Institute, La Jolla, CA.
This video depicts a storm of nerve cells in a mouse cervical spinal cord. In mice and humans, these nerves run through the cervical spine, or the neck, and control fine movements of the arms, wrists, and hands. The animation was created by Jamie Anne Mortel, a Research Assistant in the lab of Dr. Sam Pfaff at the Salk Institute for Biological Studies.
The video is a marriage of two thing I’m passionate about: effectively communicating information with novel scientific approaches and creating visually appealing interesting art. – Jamie Mortel
Mortel combined genetic labeling techniques, fluorescence microscopy, and image processing with 3D animation software. Each color corresponds to a different type of cell: V1 interneurons (red) that regulate motor neuron activity and movement, motor neurons that control bicep movement (blue), and motor neurons in charge of the tricep (green). Her goal was to better visualize the density and location of each cell type, and closely examine their connections. At 25 seconds into the video, interneurons connected to cells that control the triceps are highlighted in yellow.
The video ends with a spectacular fly-through of the spinal cord; making it hard to believe that this was Mortel’s first attempt at scientific animation!
Ultimately, mapping single cells will help scientists understand how the brain and spinal cord interact and may inform new treatments for neurodegenerative diseases and paralysis. Read more about how the video was made in this NIH Director’s blog post.
Congratulations to all of the 2021 winners! Feeling inspired? Submit your best image or video to next year’s contest in Spring 2022! Visit the contest page for updates.
Check out the rest of the articles in the ‘Art of the BRAIN’ series: