Summary: Atlas and cell census represent the initial products of the BRAIN Initiative Cell Census Network.
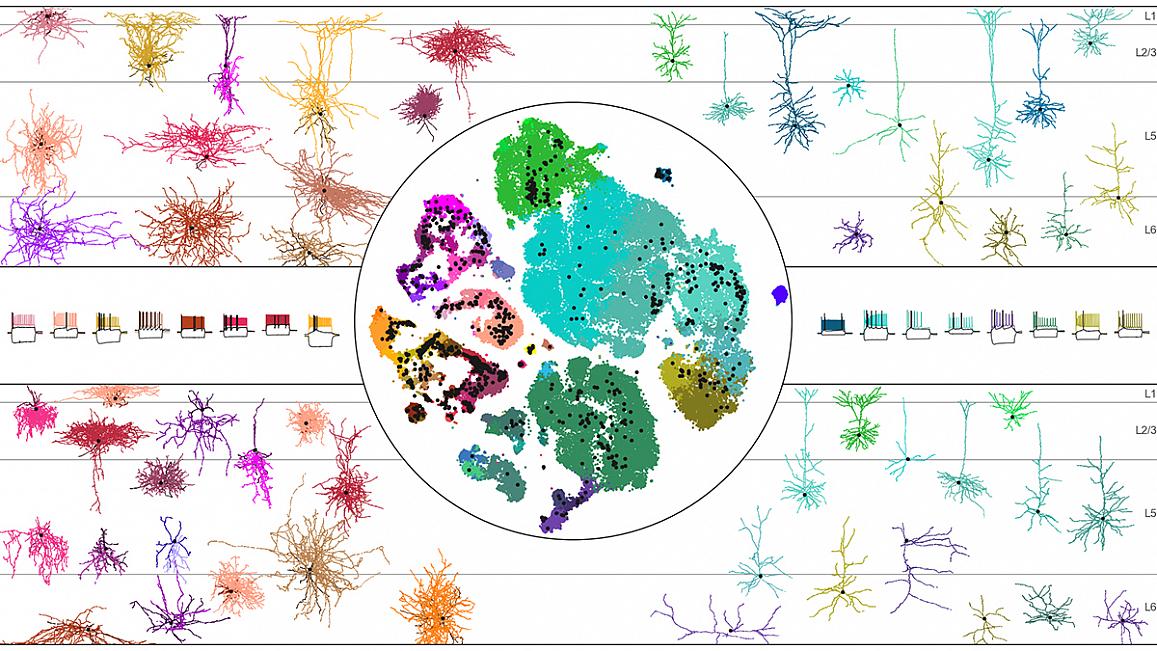
A multicolor visualization of the mouse MOp transcriptomic taxonomy overlaid with mapped neuronal cells surrounded by color-coordinated pictures of different types of neurons (GABAergic, glutamatergic, chandelier, etc.) and their electrophysiological signatures. Credit: Tolias/Nature