Summary: Another exciting set of BRAIN-related papers is highlighted this month in the latest NIH BRAIN blog's Publication Roundup.
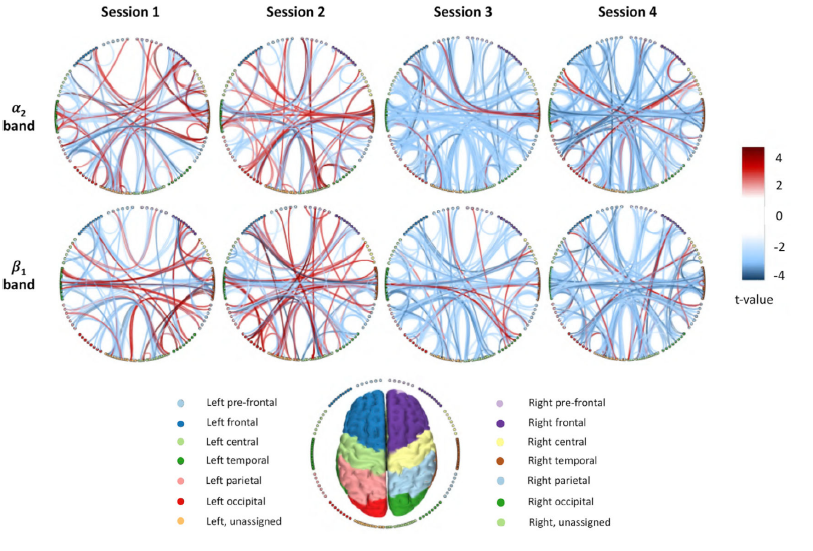
Cortical connectivity changes during BCI training. Connectivity networks obtained with MEG-source reconstructed signals in the α2 (8-12 Hz) and β1 (14-29 Hz) frequency ranges are represented here on circular graphs across four sessions involving motor imagery tasks. Within each graph, the red and blue edges correspond to higher functional connectivity levels in the motor imagery and rest conditions, respectively. The color of each node corresponds to a different brain region of interest, as shown in the bottom.